I’ve tried to visualize the data I collected using Excel but I only succeed in visualizing one section. So I am attaching the visualization and the link to the cleaned data here.
https://docs.google.com/spreadsheets/d/1r5QUq76QCrn2AjU3_s8wY7VpK3eCRY2iJRJHR0Pcvhw/edit?usp=sharing
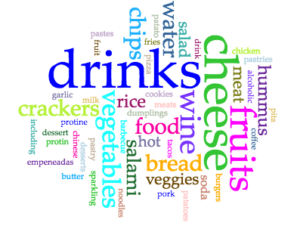
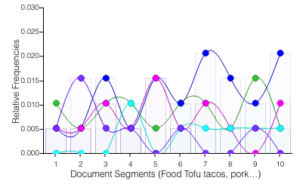
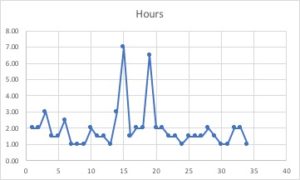
The data I collected is about the “Free Food Events” I had been to during the semester. As a poor international student whose meagre income earned by working under 20 hours per week and occasional translation gigs rarely make ends meet , I go to free food events to save money on fundamental costs of living and to ensure the quality of food I eat, as well as to learn some new knowledge about what is happening in academia and elsewhere in New York. Free food events has become a part of my life and I have gained tremendous food for the body and food for the soul attending those events. Therefore I collected data on the free food events I had been to during the semester and the meta data are as follows: the name of the events, the starting and ending time of the events, how long the events last, the dates when the events happened, and what food was served during those events. I have attempted to use Excel to visualize the data I collected but I only succeed in visualizing the “hours” column, which shows how long the events lasted. I attempted to use the “map” function of Excel to visualize the locations of the events but somehow Excel couldn’t recognize the addresses in the coloumn. I also used Voyant tools to visualize the data in the “food column” and below is what I have. Through my investigation, I think the food I eat is mostly nutritious and the diet I have had through the free food events is balanced. I can lower the hours of the free food events so I can have more time to deal with other commitments in life. I also hope that I can visualize the locations of the free food events with a map so I can learn more about the places I go to for free food events and save more time on commuting to free food events.

This entry is licensed under a Creative Commons Attribution-NonCommercial-ShareAlike 4.0 International license.